Using top to Monitor Server Performance
Viewing a server’s processor activity in real-time can aid in discovering and diagnosing any problems in CPU and memory usage. The top command is a Linux process manager that can assist with monitoring.
Reading the Screen


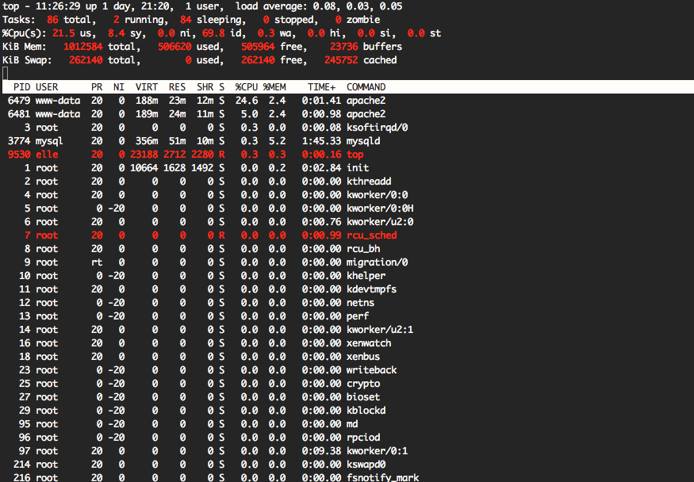
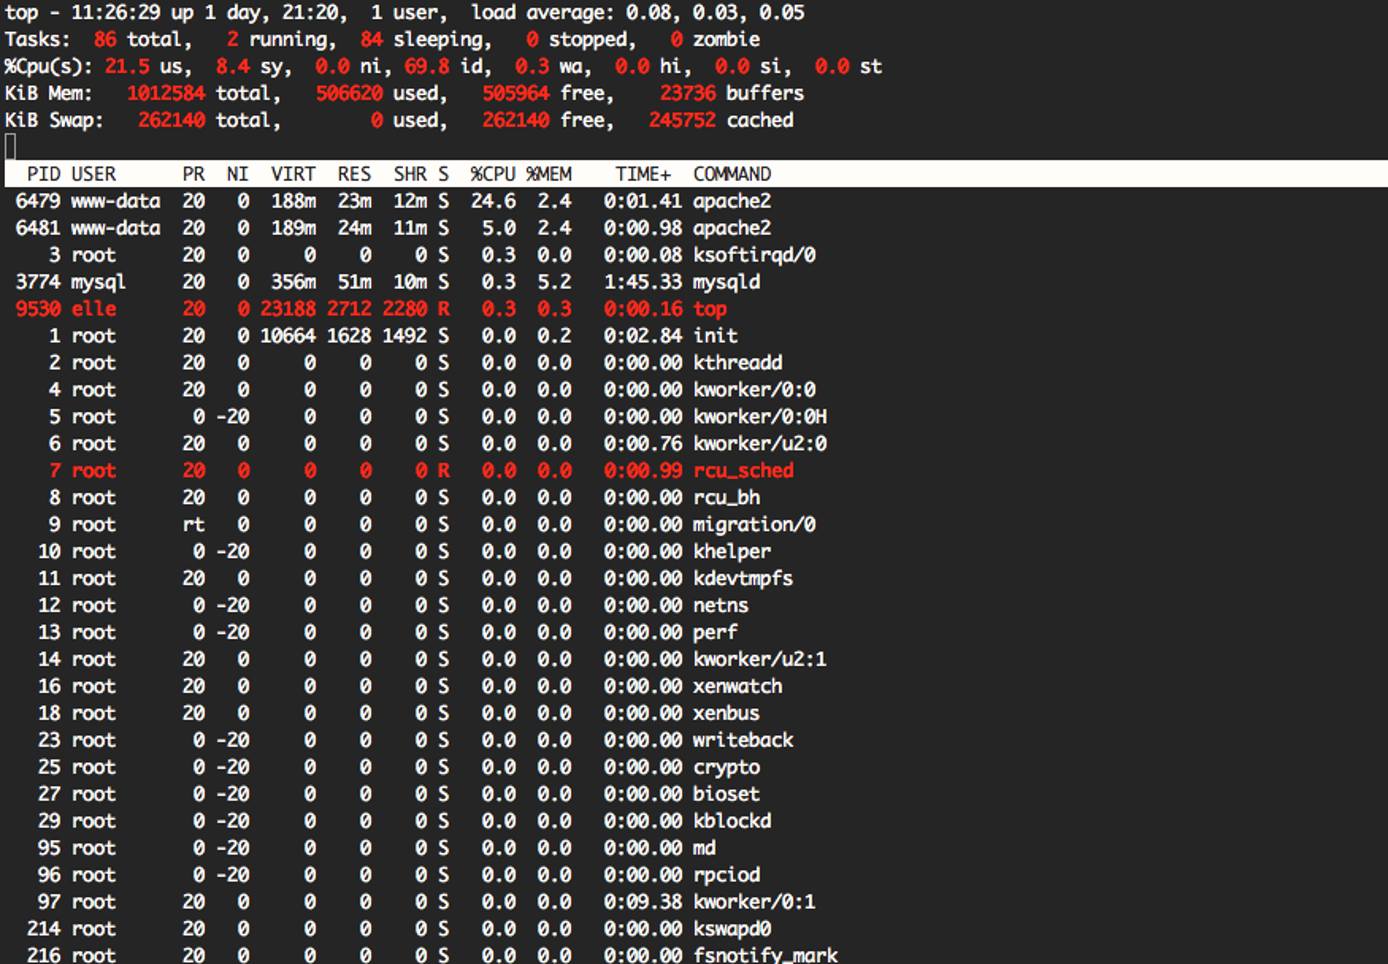
The top screen contains a variety of information regarding your server, beginning with the server’s uptime, load average, and tasks status, located in the header.

The first line contains the time, uptime, and load average values for the server. The load average is displayed over 1, 5, and 15 minutes to provide a better overall look at the load your server has undertaken. If there is a spike at one minute, but the load at the five- and fifteen-minute marks is maintained at a lower level, then consider a different response compared to when the load is consistently high through all time intervals.
Note
In order to properly read the load average section, be aware of how many CPU cores the Linode has. If there is one CPU core, then a load average of 1.00 means the server is at its capacity. This number increases to 2.00 on a Linode with 2 CPU cores, 4.00 with 4, etc.
A load of .70 for a Linode with 1 core is generally considered the threshold. Any higher than this, then reconfigure your resources or look into upgrading your plan.
A list of tasks and their various states.
The CPU percentage, including the user CPU time (
us), system CPU time (sy), time spent on low-priority processes (nice time, orni), idle time (id), time spent in wait for I/O processes (wa), time handling hardware interruptions (hi), time handling software interruptions (si), and time stolen from the virtual machine (steal time, orst).The sever’s memory usage in kilobytes.
The system’s swap usage in kilobytes.
Following the heading section is a list of processes and related data:

PID: The process ID.
USER: The username of the task’s owner.
PR: The task’s priority, ranging from -20 to 19, with -20 being the most important.
NI: The nice value, which augments the priority of a task. Negative values increase a task’s priority, while positive values decrease it.
VIRT: Virtual memory used, virtual memory being the combination of both RAM and swap memory.
RES: The resident size of non-swapped, physical memory in kilobytes (unless otherwise noted).
SHR: The shared memory size, or memory that could be allocated to other processes.
S: The processes status. Can be: Running (
R), sleeping and unable to be interrupted (D), sleeping and able to be interrupted (S), traced/stopped (T), or zombie (Z). This ties in with the task list in the header.%CPU: CPU percentage since last
topupdate.%MEM: Memory (RAM) percentage since last
topupdate.TIME+: Cumulative CPU time that the process and children processes have used.
COMMAND: Name of process.
Commands
The top command offers a set of additional commands that can be used to enhance its use through sorting and locating information.
There are two types of commands that can be used in conjunction with top: Command-line options, and interactive commands that can be used while in the program.
Command-Line Options
Command-line options can help organize and filter from the start of the program.
Important commands to know include:
-d[interval]: Sets the delay time thattopuses to refresh the results.-i: Toggles whether or not idle processes are shown.-p[PID,PID]: Allows the user to filtertopso only the defined processes are shown.-u [username]: Filters by user.-n[limit]: Setstopto run for a set amount of intervals before exiting.-b: Runstopin batch mode, ideal for log files and for use in conjunction with other programs.
Used alongside one-another, these commands can prove especially useful. For example, if you want to log a set number of processes over a period of time, you can combine batch mode, the process ID filter, the delay setting, and the iteration setting to output the results you are looking for:
top -b -p[PID] -d[interval] -n[limit]
For this example, the process ID is 2774, the delay is set to 10 seconds, and the interval is 2 cycles:
top -b -p2774 -d10 -n2
Which outputs these results:
top - 15:20:59 up 2 days,  1:14,  1 user,  load average: 0.00, 0.01, 0.05
Tasks:   1 total,   0 running,   1 sleeping,   0 stopped,   0 zombie
%Cpu(s):  0.0 us,  0.0 sy,  0.0 ni, 99.9 id,  0.0 wa,  0.0 hi,  0.0 si,  0.0 st
KiB Mem:   1012584 total,   507792 used,   504792 free,    24720 buffers
KiB Swap:   262140 total,        0 used,   262140 free,   245800 cached

  PID USER      PR  NI  VIRT  RES  SHR S  %CPU %MEM    TIME+  COMMAND
 3774 mysql     20   0  356m  51m  10m S   0.0  5.2   1:54.01 mysqld

top - 15:21:04 up 2 days,  1:14,  1 user,  load average: 0.00, 0.01, 0.05
Tasks:   1 total,   0 running,   1 sleeping,   0 stopped,   0 zombie
%Cpu(s):  0.0 us,  0.0 sy,  0.0 ni, 99.8 id,  0.0 wa,  0.0 hi,  0.2 si,  0.0 st
KiB Mem:   1012584 total,   507800 used,   504784 free,    24720 buffers
KiB Swap:   262140 total,        0 used,   262140 free,   245800 cached

  PID USER      PR  NI  VIRT  RES  SHR S  %CPU %MEM    TIME+  COMMAND
 3774 mysql     20   0  356m  51m  10m S   0.2  5.2   1:54.02 mysqld
Interactive Commands
When run on its own, not in batch mode, top is interactive. You can use commands to filter through or toggle various options, alter settings, and even manipulate tasks.
Although there are a vast number of top commands, some of the more common ones to know include:
returnorspace: Instantly update screen.dors: Alter the delay time.H: Show individual threads for all processes.i: Toggles whether idle processes will be displayed.Uoru: Filter processes by the owner’s username.1: Toggles between CPUs/CPU cores. When it reads%Cpu(s)all CPUs are being considered.%Cpufollowed by a number denotes a single CPU core.L: Locate string.<,>: Select sort field (from column names).k: Kill a process. You will be prompted to enter the PID.W: Write a configuration file. It will output the location of the file.h: Open help file.q: Quit.
Additional top-like Programs
top can be used in conjunction with other similar programs that either offer different output results or provide a more intuitive experience.
htop
The htop command is an alternative to top, offering an easier interface featuring color, mouse operation, the ability to scroll through processes (horizontally and vertically). It is overall more intuitive, although providing similar output as the regular top command.
To install:
For Debian/Ubuntu:

  apt-get install htop
For CentOS/Fedora: yum install htop
Run htop by entering:
htop
The htop screen runs similar to top, but with scroll and mouse support, and a variety of menus that allow for more intuitive use. When a process is highlighted you can act on that process, such as pressing k (kill). To learn more regarding htop commands, press h to open its help menu.
iotop
The iotop command tracks the input/output operations on a per-process basis. iotop must be run as root or with the sudo prefix.
To install:
For Debian/Ubuntu:
apt-get install iotop
For CentOS/Fedora:

  yum install iotop
Run iotop by entering:
iotop
To focus only on processes running, run it with the --only suffix:
iotop --only
iotop also shares a number of command line options with top including: -n, -b, -d, -u, and -p, but is not interactive. To learn more about operating iotop, run iotop -h in your terminal.
More Information
You may wish to consult the following resources for additional information on this topic. While these are provided in the hope that they will be useful, please note that we cannot vouch for the accuracy or timeliness of externally hosted materials.
This page was originally published on

